

Ethereum heading straight for $350
Ethereum heading straight for $350
Technical Breakdown

Dear Traders,
Today is the 21st July 2020, let’s get another daily technical breakdown published and talk about some of the recent moves we have seen on both the LTF and HTF charts. I hope this newsletter helps to explain in more detail my current bias for PA and where I think we could be heading over the coming days, weeks, and months! Enjoy!
Daily Breakdown
I wanted to write a little more about Ethereum in this newsletter as it seems as though we are starting to see some clear signs of bullish momentum on both HTF & LTF analysis. Firstly let’s start off by taking a look at this HTF chart from a few weeks ago on twitter that I posted. As you can see from the chart below, the last we tested this range was in February this year and then before that August last year, as you can clearly see the huge difference in PA structure from these different periods…

Previously price has always fell short in this range with a huge amount of sellers taking profits and just price usually getting wicked back down below within just a few days or even in weeks at the very most. Price has never accumulated in this range and there have been no periods of calm, consistent price action in this range.
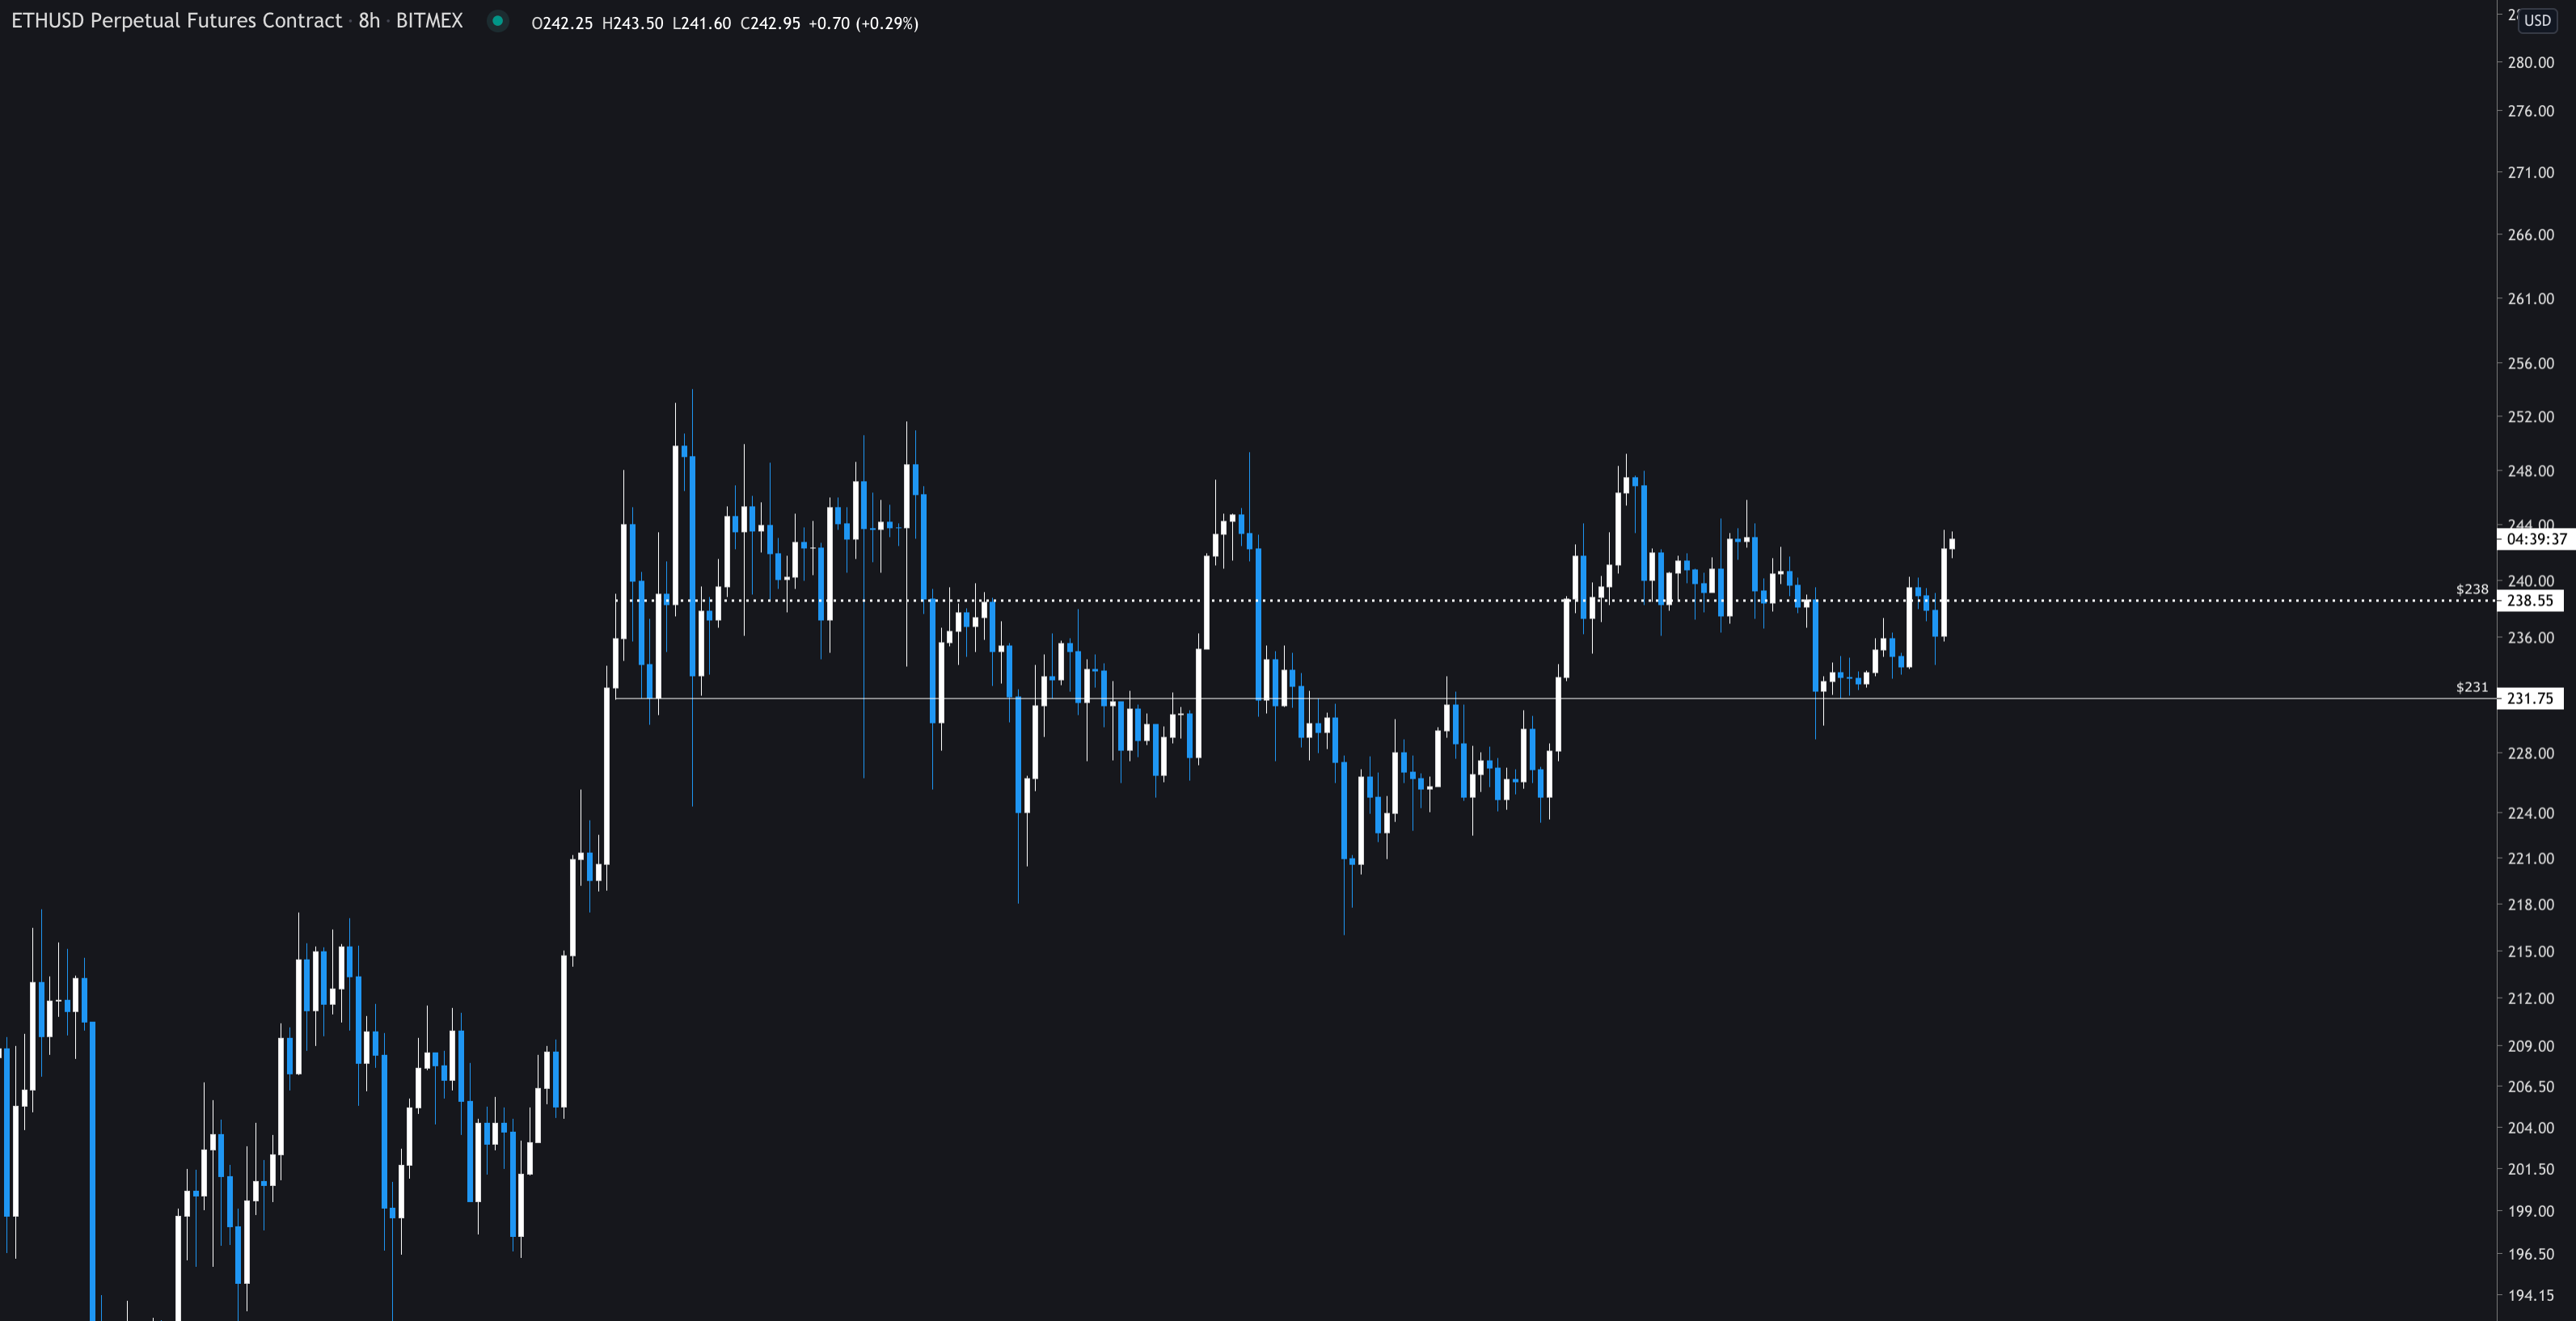
The time price action is looking different in my opinion, we are seeing accumulation above our range low and overall buyers are continuing to step in to defend and buy spot long positions. $225 at our range low really seems to be acting as crucial and strong support and has helped successfully for the past 50 days.

As you can see from this other HTF chart above, even though price action is holding well in terms of HTF support, there is this one clear resistance level that needs to be taken out by bulls before we can really see price start ramping up. This $242/244 resistance level has been a significant resistance level for price action for some time now and once bulls break above this level I think we can see a retest of the highs from summer of 2019. This should give bulls the momentum to get a clear test of $350.
In short, I think HTF structure looks like accumulation and is looking strong with fresh buyers stepping inconsistency, even though this type of structure at resistance could be considered distribution, I remain bullish until we break down further.
Nothing super interesting on the LTF but still consistent buys to defend PA on the retests once PA falls below $230 level, thinking currently if we can close the daily around $242 then this should give us the momentum to head higher and test our local highs. Price currently heavily tied with Bitcoin as usual so of course, we need some smooth sailing on that front, but overall I am feeling comfortable being long here.
⭐️ SPONSOR ⭐️
This newsletter is made possible by our sponsors PrimeXBT, Prime is the exchange that I use on a daily basis to place my main leverage trades for both BTC & ETH. I got so annoyed with other exchanges having order book and order submission issues I had to find an exchange that actually placed my order and was super reliable… that’s Prime!

Also, PrimeXBT is giving readers of this newsletter an additional incentive to sign up today, If you want to get a 50% bonus on any deposit up to 1 BTC (bonus is for trading only) then please use code ‘CACTUS50’, and if you would like to get 25% off all your fees on the exchange then use code ‘CACTUS25’. Happy trading everyone!
This is currently the only leverage-based platform that I am enjoying trade on!
Let’s also take a look at BTC on a lower timeframe as we have seen some bullish movement over the past 12 hours and while our HTF has not shifted really since the last market breakdown, it might be interesting from an intraday perspective as to where we might be heading next.… lets just straight into it.

As you can see in the chart above, LTF momentum for BTC/USD has shifted bullish as we now are finally seeing price break above $9200 with conviction and get some strong volume. Currently looking good and some decent hourly closes with not much resistance at these current levels. If we do end up falling back down then $9200 should hopefully be showing as flipped support as price re-accumulates.
I think over the next 24 hours we will see BTC/USD move towards this major resistance level at $9500, a level that has to be flipped again if we want to continue this move the upside and see a shift in HTF analysis. Flipping and taking out $9500 would put us into a HTF bullish position as this level has been resistance for the longest time now, flipping it would be crazy for bulls momentum. Likely leading us back to highs.
Thanks everyone for reading this technical breakdown, if you enjoyed please make sure to sign up with your email address as I do this every week! Thanks again!