

Trading: S/R flip & EQ levels
Trading: S/R flip & EQ levels
Technical Newsletter

Good afternoon everybody, firstly again I would just like to say a huge thank you to everyone who is reading and signing up to this newsletter over the past two days, the support has been insane and thousands of you seem to be really enjoying this more detailed content compared to that of just some charts on twitter and telegram…
This evening I wanted to share an article I wrote a few weeks ago. I have cleaned it up a little and made some adjustments but I think it is very important for all traders.
So firstly I will start by describing the principle behind S/R flips, how they are used to trade PA and how useful they can be when trying to find a good entry. We will also cover the EQ (Equilibrium) level, I wanted to include this small level into this article as I sometimes receive comments asking about it and even though it may be fairly simple it’s still extremely effective.
Introduction
S/R Flips: Firstly S/R stands for Support/Resistance, the idea behind the flip is that this method of setup is confirmed when price reclaims a level that was previously lost, then uses that now taken level as new support or resistance.
EQ: As mentioned EQ stands for Equilibrium, this is the middle point were supply and demand are equal, this is normally easy to spot when the price is trading in a range, as the EQ level will simply be the middle of that range.
The Setup
S/R Flip:
Firstly let’s look into the setup of an S/R flip and how we can use this useful trading setup to find good risk to reward (R:R) trades, and also know how much momentum price action has when running into important key levels.

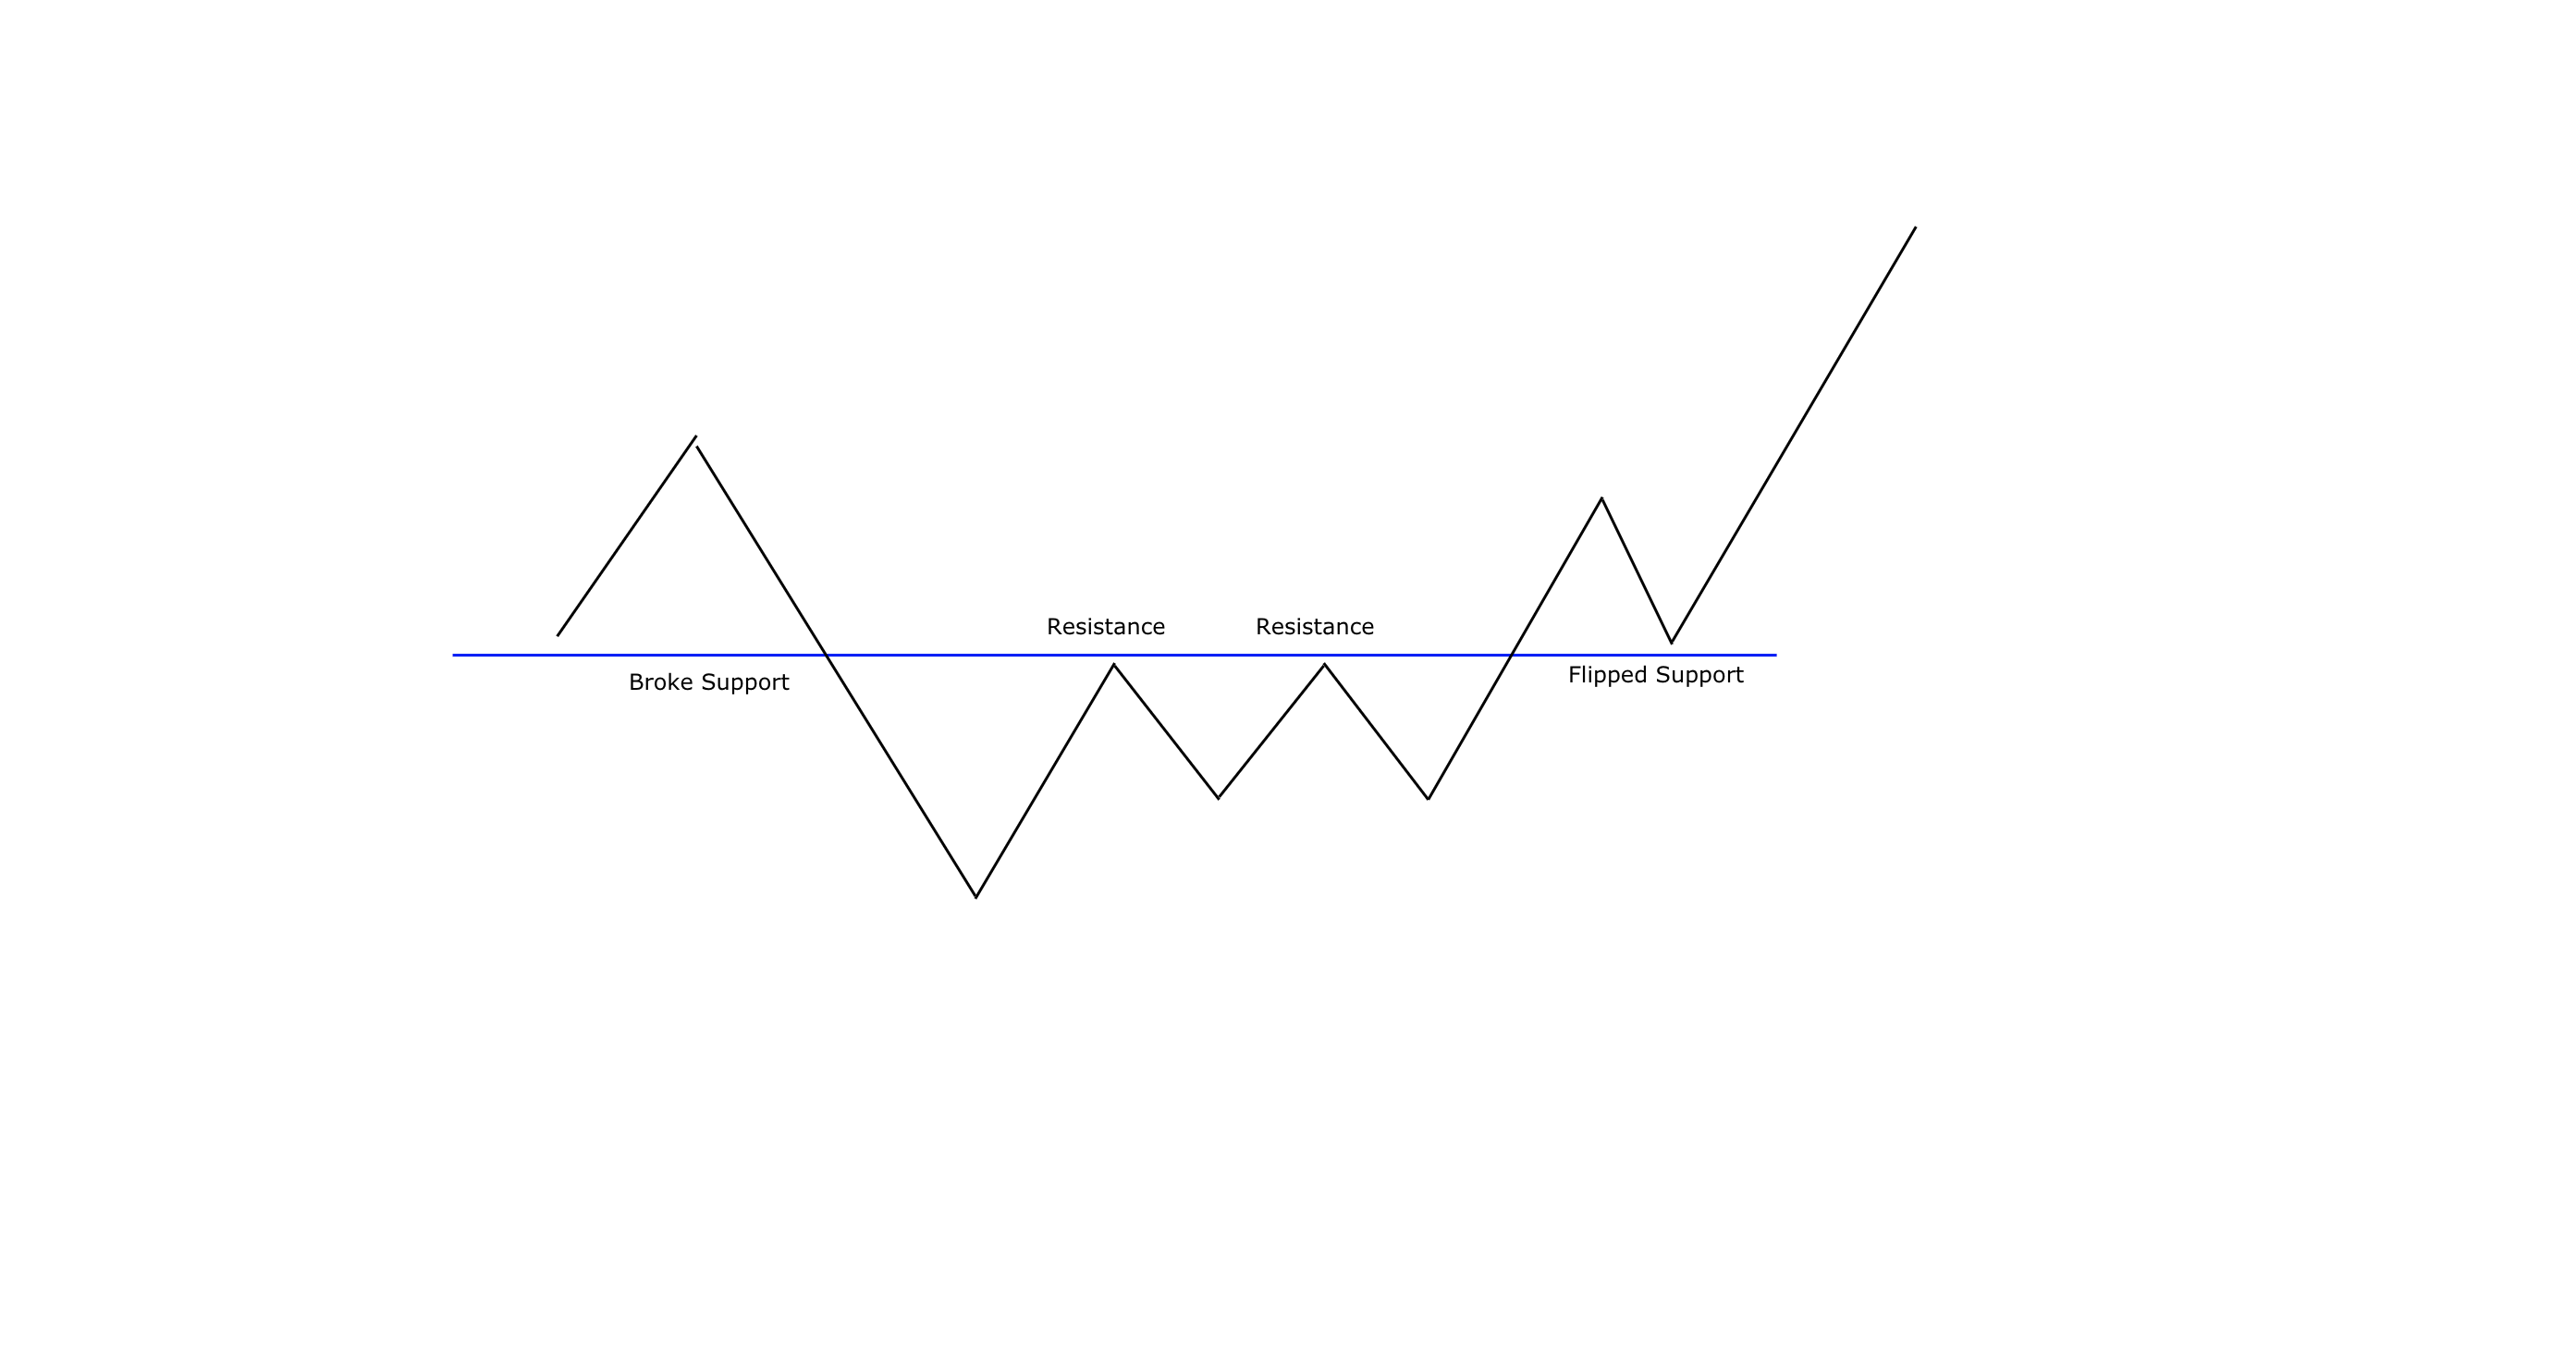
As shown above, this is a simple S/R setup. So first we defined a clear support for price, this level has historically been a strong level and we are confident that when price touches this level we will see some support/resistance.
After the support has been defined (Blue Line) we can now see how price reacts to this level. As shown above, the level is broken straight away on the initial move down, our support level did not support price and so this level now will be flipped into resistance for the future. Hence the name ‘S/R flipped’.
The idea behind trading on an S/R flip is that you wait for price to break a level, wait for it to retest and then enter the trade on the premise that there is strength. In the example above this is shown when price breaks back above our now resistance level (not a time to enter long) and then comes back down to this ‘resistance’ and uses it as support, (This level has now been flipped) to give momentum to buyers and support PA for another move up.
This is a useful strategy to make sure that when taking a long position, we are first validated that buyers have strength. This will greatly help minimise getting trapped into situations such as false breakouts and buying into weakness.
Let’s take a quick look at a bearish example which is a little different…
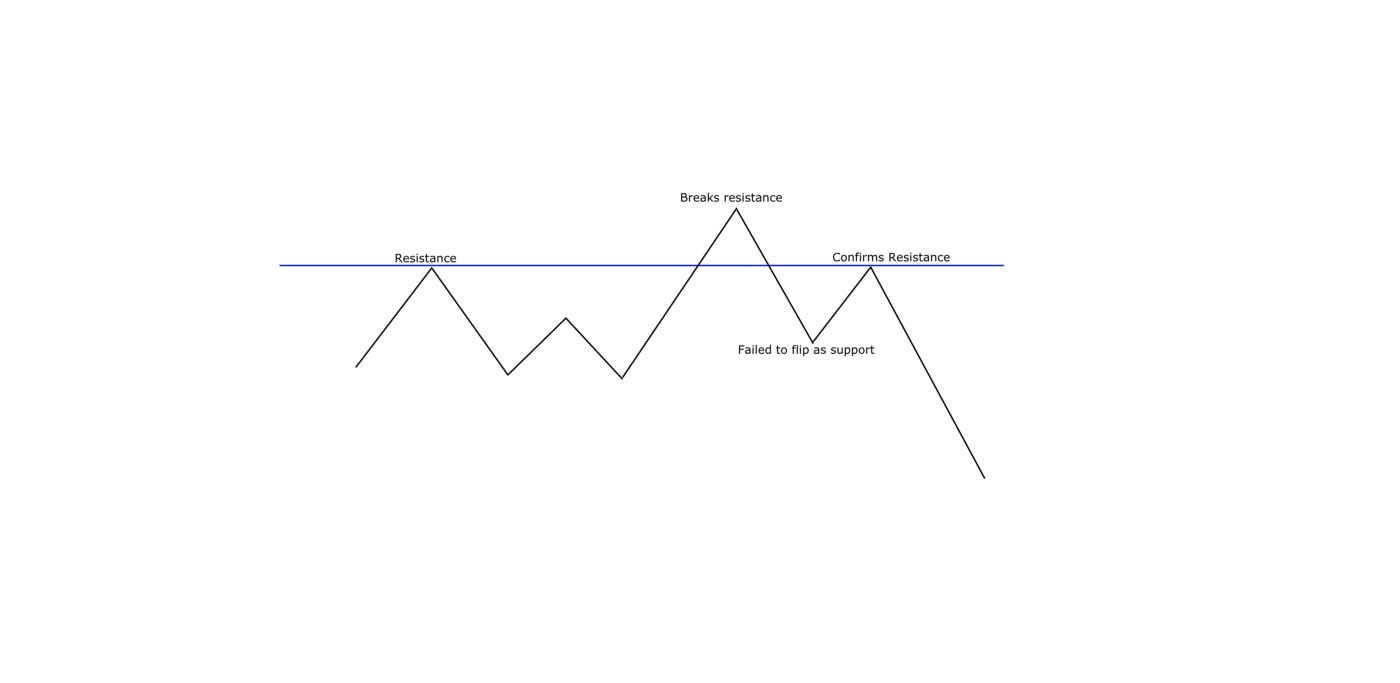
As you can see in the image above, this example if from a bearish chart that is now running into major resistance, as a buyer we would like this level of course flip into support as we head higher, but in this case, PA fails.
Price hits resistance, fails to break through as we see a short pullback, then we see another attempt at breaking higher, in which this time buyers are successful. Now what happens next is price is quickly dropped back below this level by sellers without any consolidation above, and then on the final retest we see one last failed attempt to break upwards (bearish retest) which confirms the level as resistance, signalling that buyers have lost their momentum and sellers are in majority control.
I hope this makes sense, it’s a very simple to understand strategy that pretty much all traders use to help minimise risk and find setups which are truly optimal for R:R.
EQ (Equilibrium):
Firstly just to recap, an equilibrium in terms of trading is the exact middle point where buying and selling pressure is equally matched. This means that an EQ level is normally found between the highest and lowest level of a price action range…


Let’s look at how easy and EQ level can be spotted/found when trading…


Looking at the diagram above, we can see that price has produced a range.
Once you have defined a range the EQ will be equal to the middle of that range. While an EQ level is just the middle point of a range where buyers and sellers are equal, this level is well respected by price action and can be used as clear S/R.
Pretty easy, but just wanted to cover it as had some comments in the past.
Live Example
S/R Flips:
In the example below, this is something which we see time and time again with volatility in the crypto market. Price is trading sideways, we see a quick break down with very small consolidation before price shoots back above this level and is flipped into support before price starts to get higher. This gets a lot of traders liquidated.
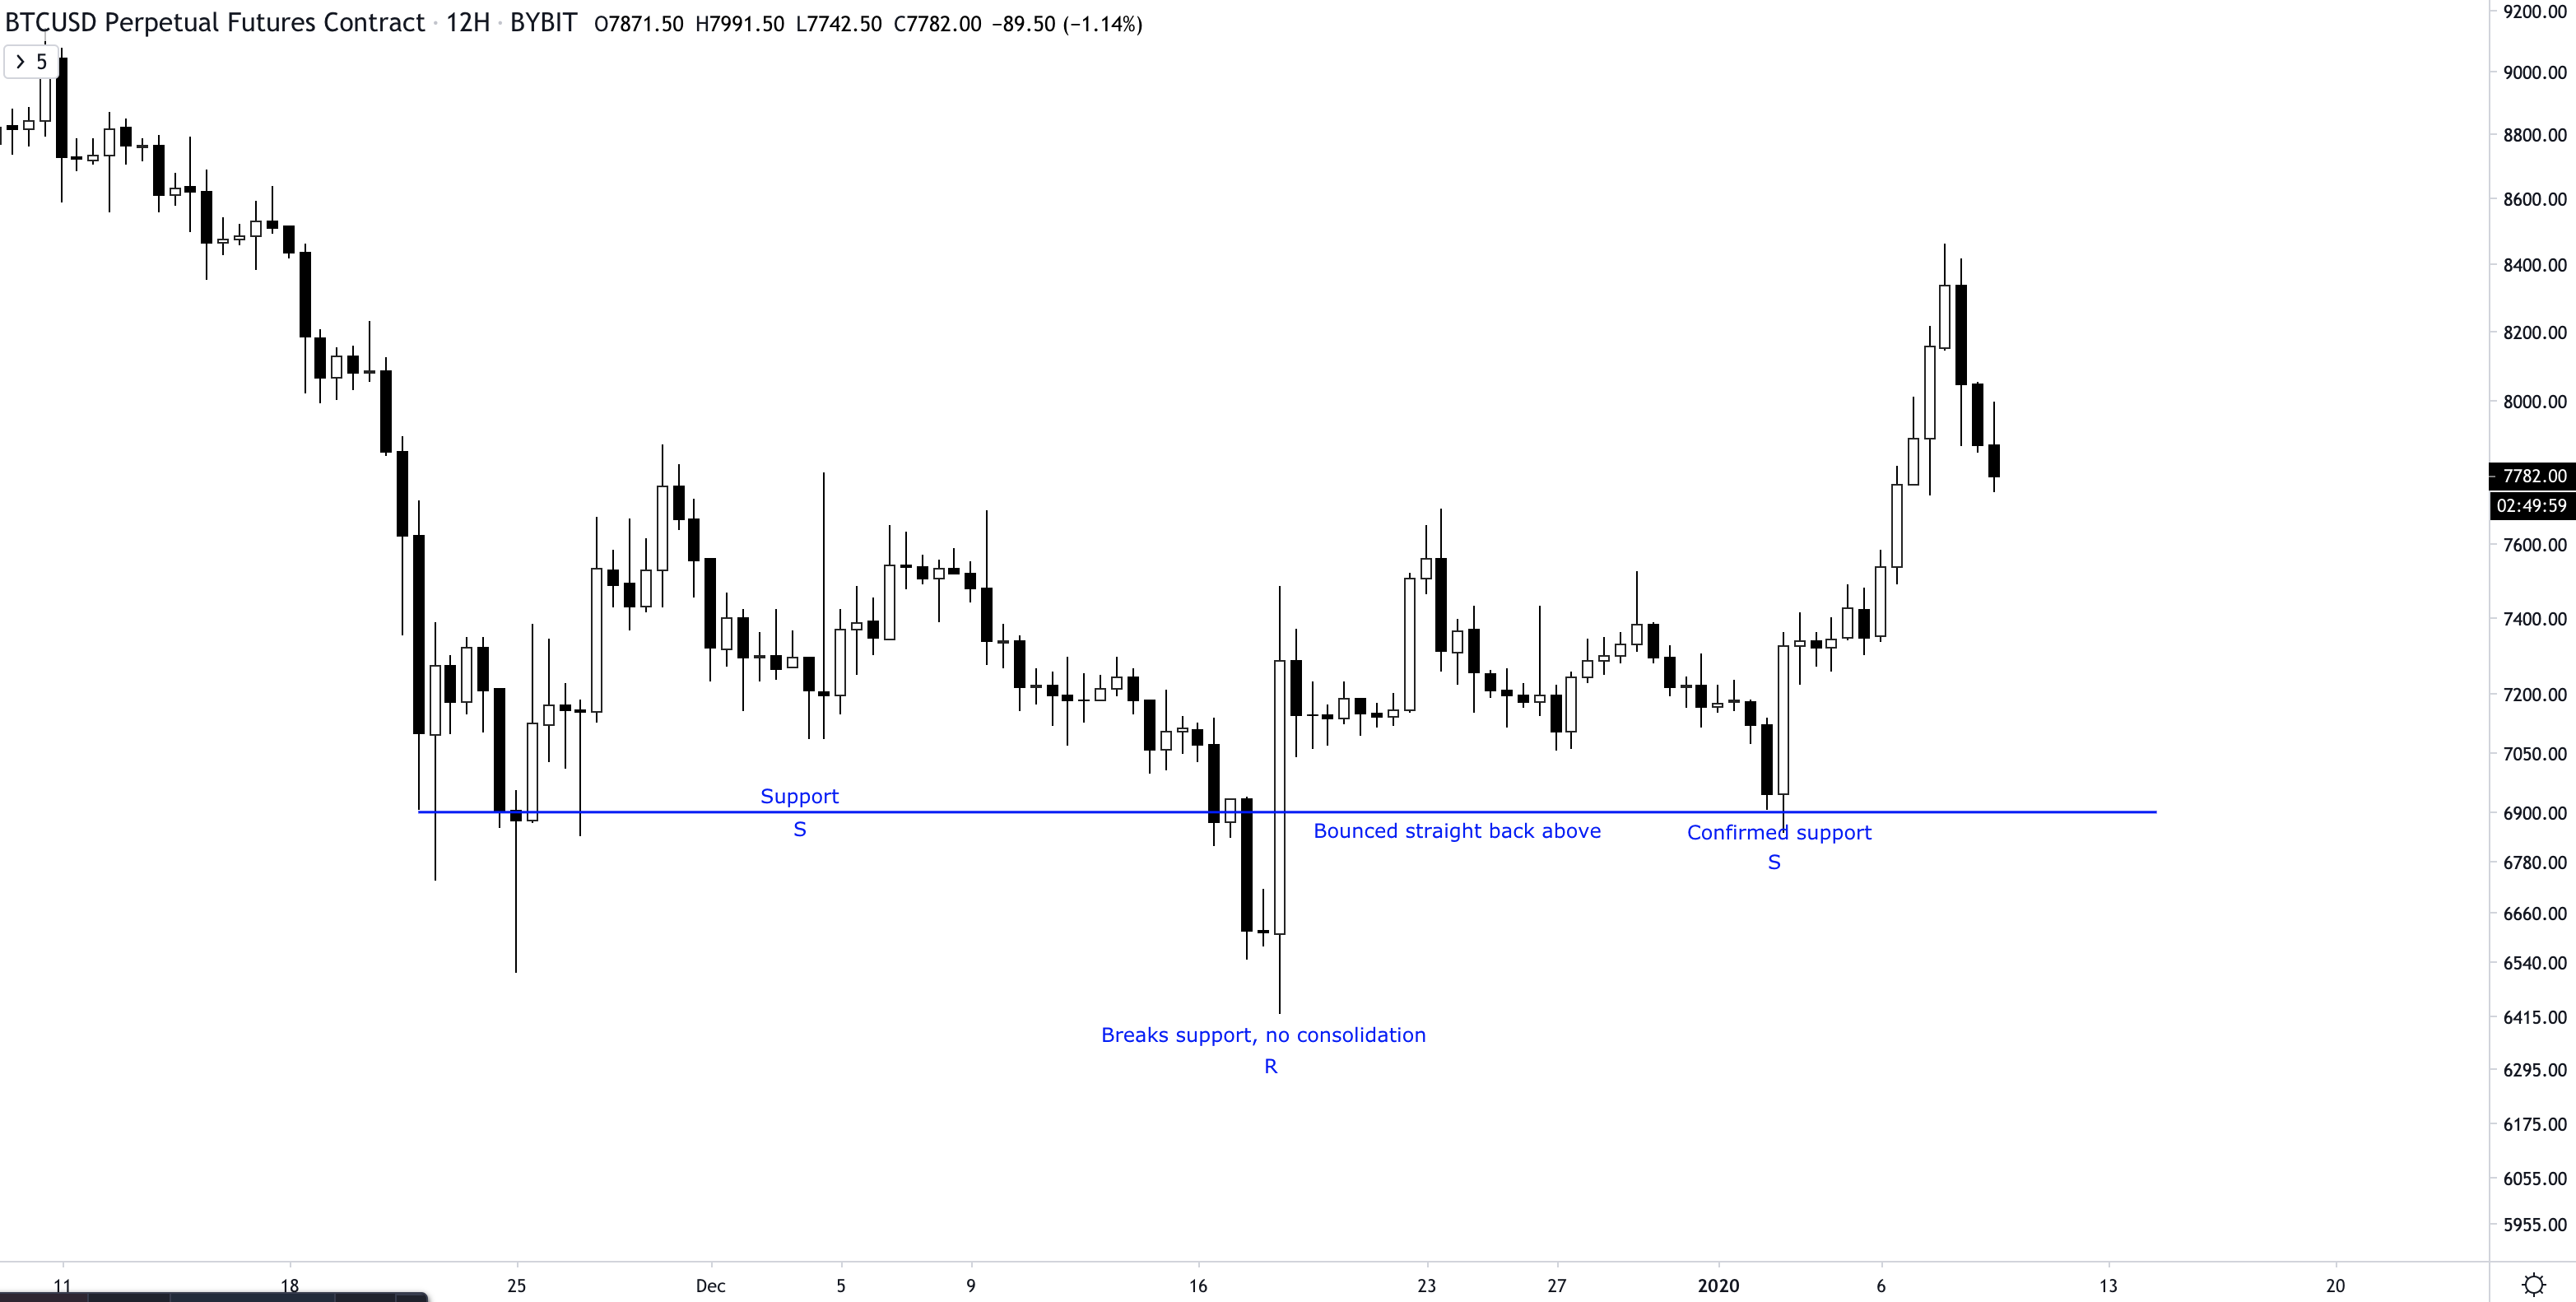
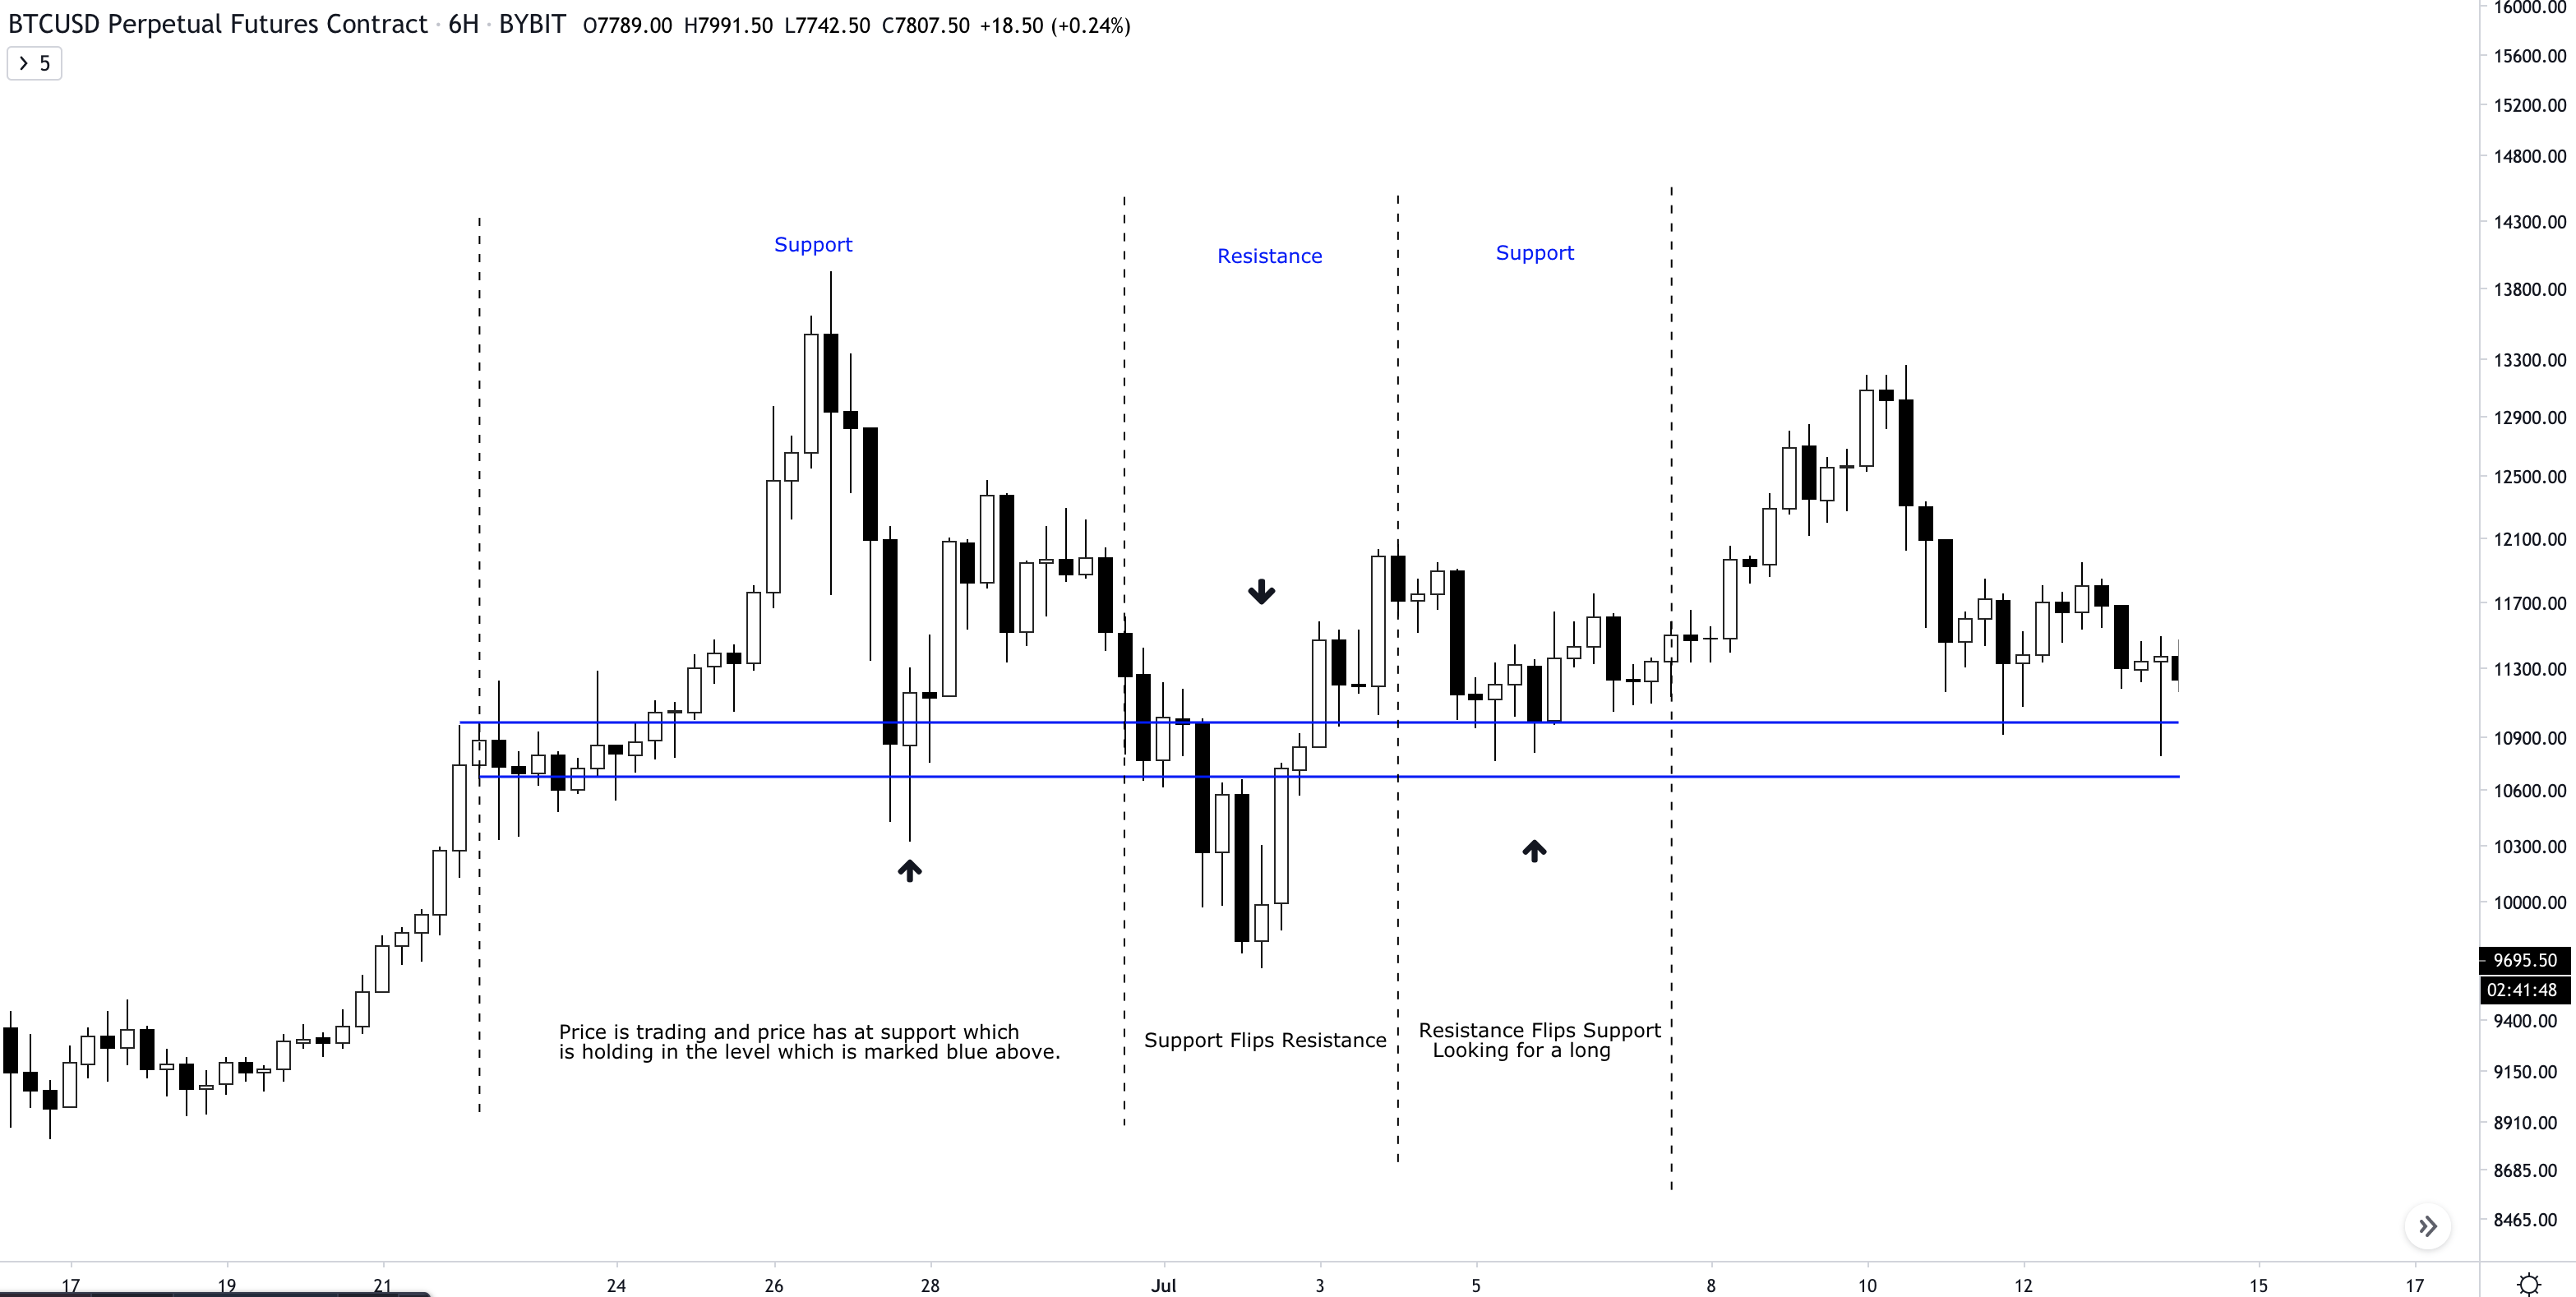
The above image shows a similar diagram as the first but this we see price consolidate more after the initial dropdown. On that initial break below our blue support, our blue support is now flipped as resistance. How we would trade this would be to wait for price to either come back up to test the level to confirm it as resistance before we head lower, or what actually happened in this case was that price flipped resistance back into support before we see another leg up. A clear live example of using S/R flips.
EQ Levels:
This is extremely simple so I will not go into loads of detail, but as long as you have your range marked out correctly from the swing high to the swing low then marking your EQ is just the middle of the two. Use this level as an additional S/R level.

I’m not going to show any more examples of an EQ level as its self explanatory.
If you enjoyed this little newsletter then please make sure to subscribe to stay up to date with my daily content. I hope everyone is staying safe and well at the moment!
Thanks (see you tomorrow)
- Cactus